Percentage of World Population in Four Countries (1950-2050)
IELTS Academic Writing Task 1 - Bar Graph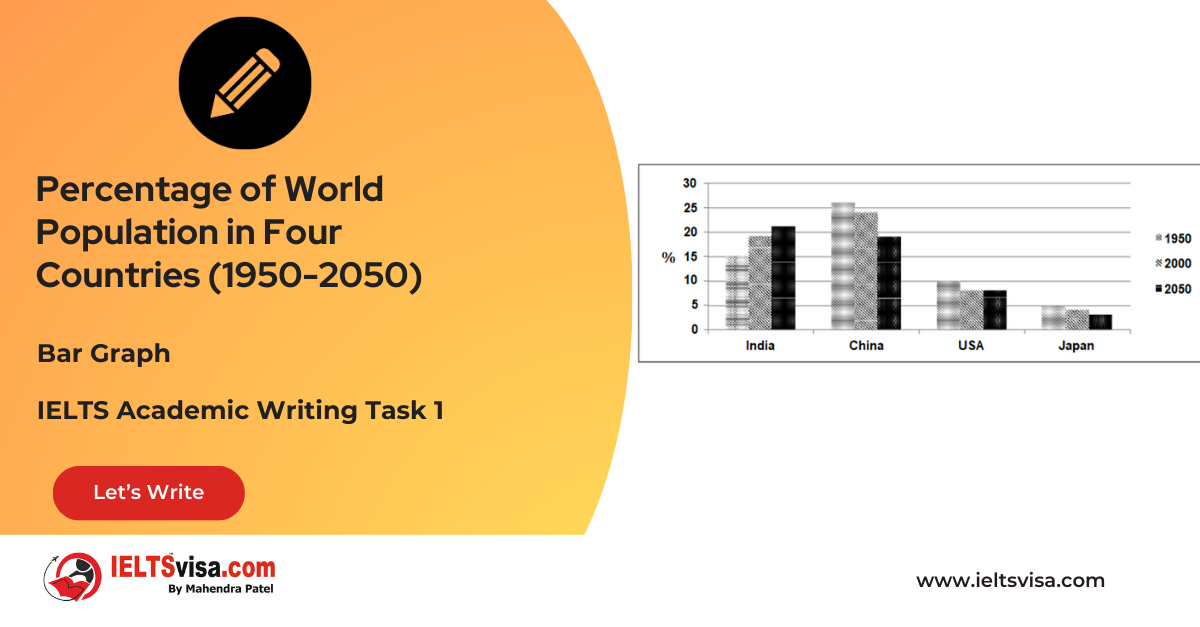
IELTS Writing Task 1 Question
The chart below shows the percentage of the whole world population in four countries from 1950 to 2000, with projections till 2050. Summarise the information by selecting and reporting the main features and make comparisons where relevant.
 image")
Common Questions for the Bar Graph
1. Graph Type: Bar Graph
2. Title: Percentage of World Population in Four Countries (1950-2050)
3. Units of Measurement: Percentage
4. Who: Four countries (India, China, the USA, and Japan)
5. When: 1950, 2000, and projections for 2050
6. Where: Global comparison
7. Topic: Changes in the proportion of the world population across four countries over time
Comparison Showing and Trends Any change over time (such as an increase or a decrease) is a trend.
Comparison 1: China’s Population Trend
- Details:
1. Held the highest share of the world population in 1950 (over 25%).
2. Declined to just under 25% by 2000.
3. It is predicted to decrease further to approximately 19% by 2050.
Comparison 2: India’s Population Growth
-
Details:
1. Accounted for 15% in 1950.
2. Increased to 19% by 2000.
3. Projected to surpass China at nearly 20% by 2050.
Comparison 3: The USA and Japan
-
Details:
1. Both countries experienced a decrease from 1950 to 2000.
2. The USA is expected to maintain its 2000 proportion until 2050.
3. Japan’s share is predicted to fall continuously, reaching around 3% by 2050.
Sample Answer
The bar chart illustrates the percentage of the global population represented by four countries—India, China, the USA, and Japan—in 1950, 2000, and projections for 2050. It highlights significant shifts, with India expected to become the most populous among them by 2050.
Overall, the data suggest that while India’s population is set to rise and surpass China’s by 2050, Japan will see the most significant decline among the four countries.
In 1950, China accounted for slightly over a quarter of the world’s population, the highest among the four nations. Although this figure declined to just under 25% by 2000, China still maintained its lead. However, projections indicate a continued decline, reaching approximately 19% by 2050. Conversely, India’s share, starting at 15% in 1950, showed a steady increase to 19% by 2000. It is anticipated to rise further and become the highest among the four, at nearly 20% by 2050.
The USA and Japan demonstrated decreasing trends from 1950 to 2000. The USA’s proportion is expected to remain stable beyond 2000, while Japan’s population share, already the lowest in 2000, is projected to fall to about 3% by 2050.
Top 5 Vocabularies
| Vocabulary (type) | Meaning | Synonyms | Examples |
| Projection (n.) | An estimate or forecast | Forecast, prediction, estimate | Projections show that India’s population will increase by 2050. |
| Account for (v.) | To make up or represent a portion | Constitute, comprise, form | China accounted for over 25% of the global population in 1950. |
| Decline (v.) | To decrease or diminish | Decrease, reduce, drop | China’s population share is projected to decline further by 2050. |
| Trend (n.) | A general direction of change | Pattern, movement, direction | India showed an upward trend in population percentage. |
| Significant (adj.) | Notable or important | Major, notable, considerable | Japan is predicted to see a significant decrease in its population share. |


Our Books

Master IELTS Speaking Part 1
IELTS Writing Task 1 Book
IELTS Writing Task 2 Book
Writing Task 1 Question Types
Practice IELTS Other Modules
IELTS Listening
The IELTS Listening test assesses how well you can understand spoken English in various contexts. It lasts about 30 minutes and is divided into four sections with a total of 40 questions. The listening tasks become increasingly difficult as the test progresses.
IELTS Academic Reading
The IELTS Academic Reading section assesses your ability to understand and interpret a variety of texts in academic settings. It is designed to evaluate a range of reading skills, including skimming for gist, reading for main ideas, reading for detail, understanding inferences, and recognizing a writer's opinions and arguments.
IELTS Speaking
The IELTS Speaking test assesses your ability to communicate in English on everyday topics. It lasts 11-14 minutes and consists of three parts: introduction, cue card, and a discussion based on the cue card topic.
IELTS General Reading
IELTS General Reading tests your ability to understand and interpret various types of texts. Here are some key areas and types of content you can expect to encounter in the reading section, along with tips for effective preparation.
IELTS Academic Writing Task 1
In IELTS Academic Writing Task 1, you are presented with a visual representation of information, such as graphs, charts, tables, or diagrams, and you are required to summarize, compare, or explain the data in your own words.
IELTS General Writing Task 1
In IELTS General Writing Task 1, you are required to write a letter based on a given situation. The letter can be formal, semi-formal, or informal, depending on the prompt. Here’s a breakdown of the key components to include in your letter
IELTS Academic Writing Task 2
In IELTS Academic Writing Task 2, you are required to write an essay in response to a question or topic. Here’s a guide to help you understand the essential elements of this task
IELTS Exam Tips
To succeed in the IELTS exam, practice regularly, familiarize yourself with the test format, improve your vocabulary, develop time management skills, and take mock tests to build confidence.
Grammer for IELTS
Grammar is the foundation of effective communication in English. Understanding tense usage, subject-verb agreement, and sentence structure enhances clarity and coherence in writing and speaking.
Vocabulary for IELTS
Vocabulary plays a crucial role in the IELTS (International English Language Testing System) exam, especially in the Speaking and Writing sections. Here’s an overview of why vocabulary is important and how it impacts your performance
RECENT IELTS SAMPLES QUESTIONS AND ANSWERS

Task 1 – Diagram – A conference hall built in 1981 and planned for 2020
20:00 Start Pause Stop [df_adh_heading title_infix="IELTS Writing Task 1 Question" use_divider="on"...
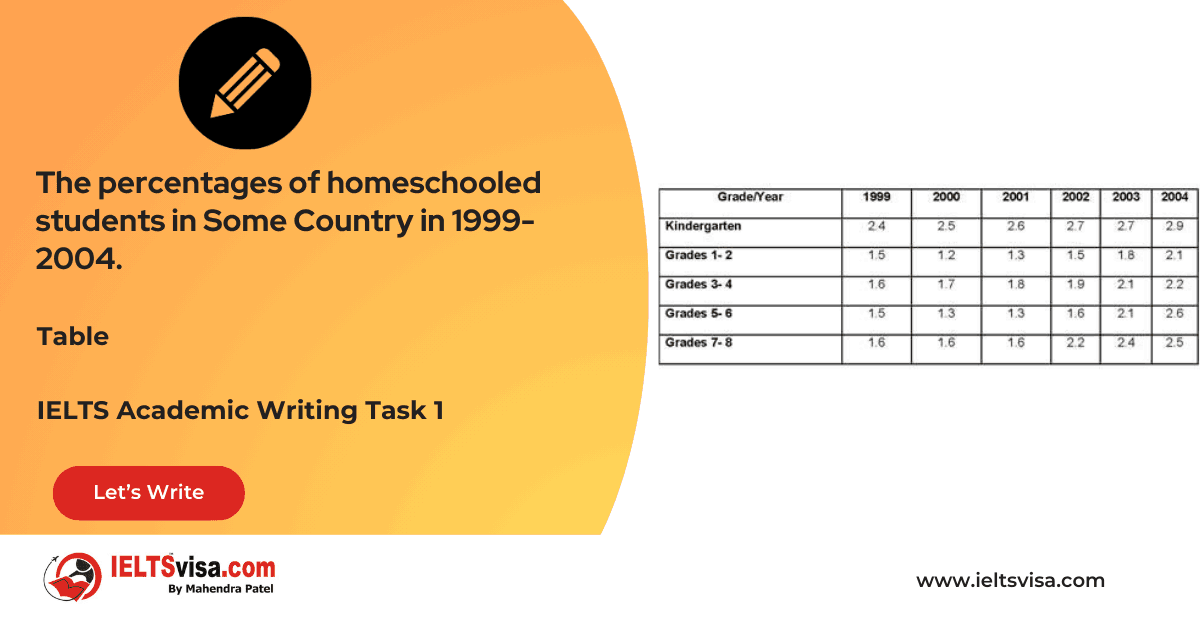
Task 1 – Table – The percentages of homeschooled students in Some Country in 1999-2004.
20:00 Start Pause Stop [df_adh_heading title_infix="IELTS Writing Task 1 Question" use_divider="on"...

Task 1 – Table – For a university tutor describing the information shown.
20:00 Start Pause Stop [df_adh_heading title_infix="IELTS Writing Task 1 Question" use_divider="on"...
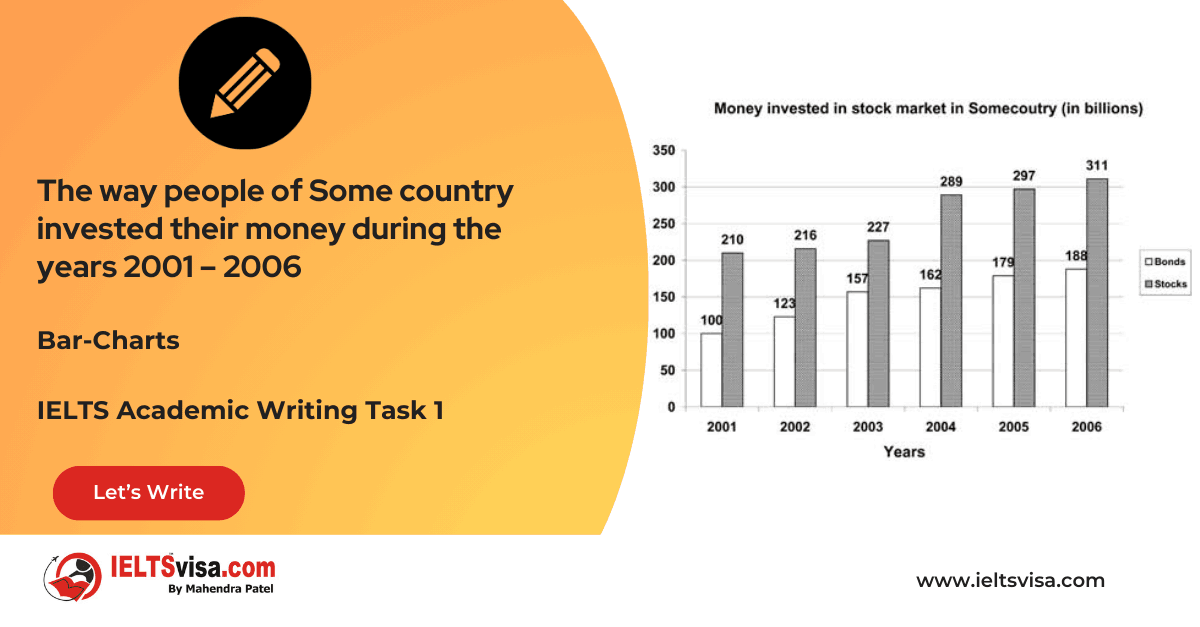
Task 1 – Bar-Charts – The way people of Some country invested their money during the years 2001 – 2006
20:00 Start Pause Stop [df_adh_heading title_infix="IELTS Writing Task 1 Question" use_divider="on"...

Task 1 – Diagram – Rainwater Harvesting and Conversion to Drinking Water in an Australian Town.
20:00 Start Pause Stop [df_adh_heading title_infix="IELTS Writing Task 1 Question" use_divider="on"...

Task 1 – Column graph – Percentage of Young People Enrolled in Universities in 2000 and 2007.
20:00 Start Pause Stop [df_adh_heading title_infix="IELTS Writing Task 1 Question" use_divider="on"...
Our IT Company Services


