by Mahendra Patel | Feb 6, 2025 | IELTS Academic Writing Task 1 Essay, Line Graphs
The population size, birth rate and the death rate of England and Wales from 1700 to 2000 IELTS Academic Writing Task 1 - LineGraph 20:00 Start Pause Stop IELTS Writing Task 1 Question The line graph below shows the population size, birth rate and the...
by Mahendra Patel | Feb 6, 2025 | IELTS Academic Writing Task 1 Essay, Line Graphs
The sales of children's books, adult fiction and educational books between 2002 and 2006 in one country. IELTS Academic Writing Task 1 - Line Graph 20:00 Start Pause Stop IELTS Writing Task 1 Question The graph below shows the sales of children’s...
by Mahendra Patel | Feb 6, 2025 | Bar Charts, IELTS Academic Writing Task 1 Essay
The participation of Australian children in sports outside school hours in 2014 IELTS Academic Writing Task 1 - Bar Graph 20:00 Start Pause Stop IELTS Writing Task 1 Question The graph below shows the participation of Australian children in sports...
by Mahendra Patel | Feb 6, 2025 | Bar Charts, IELTS Academic Writing Task 1 Essay
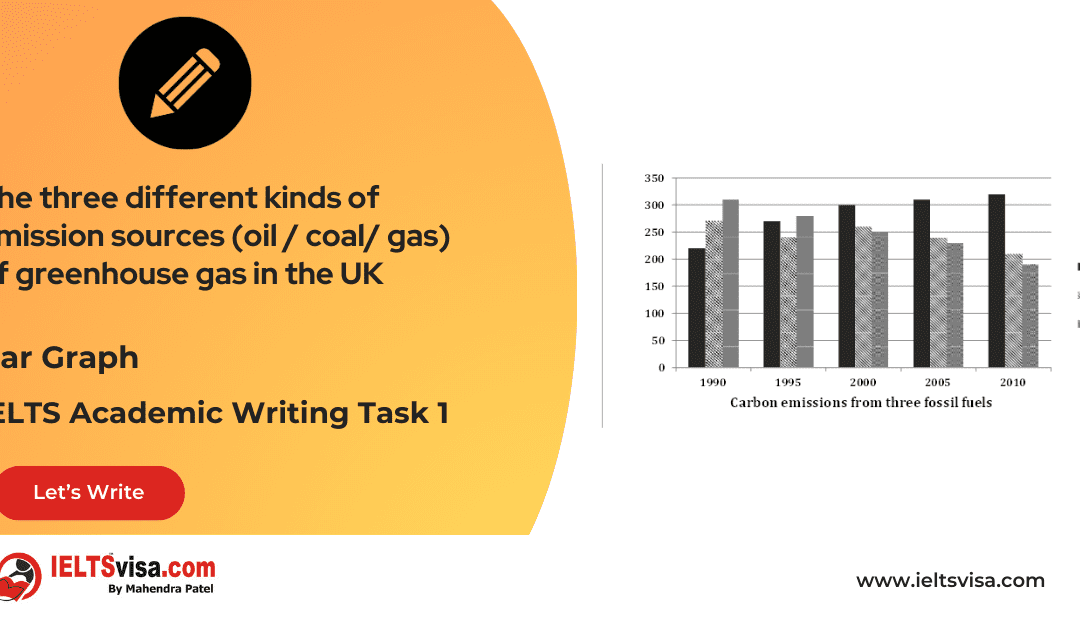
The three different kinds of emission sources (oil / coal/ gas) of greenhouse gas in the UK IELTS Academic Writing Task 1 - Bar Graph 20:00 Start Pause Stop IELTS Writing Task 1 Question The graph below shows the three different kinds of emission sources...
by Mahendra Patel | Feb 6, 2025 | Bar Charts, IELTS Academic Writing Task 1 Essay
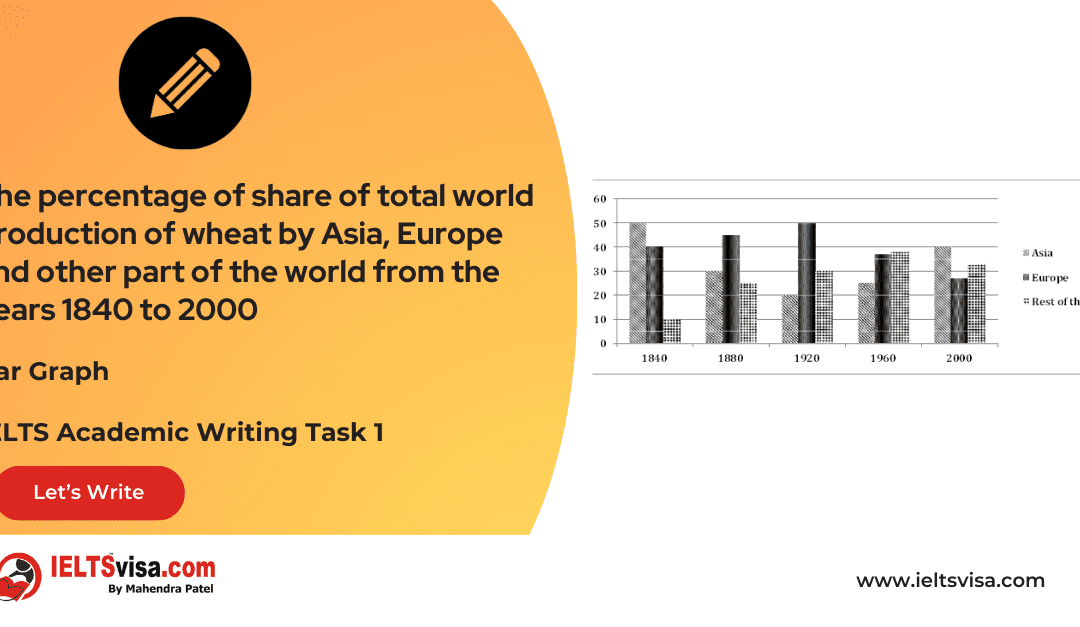
The percentage of share of total world production of wheat by Asia, Europe and other part of the world from the years 1840 to 2000 IELTS Academic Writing Task 1 - Bar Graph 20:00 Start Pause Stop IELTS Writing Task 1 Question The diagram below shows the...
by Mahendra Patel | Feb 6, 2025 | Bar Charts, IELTS Academic Writing Task 1 Essay
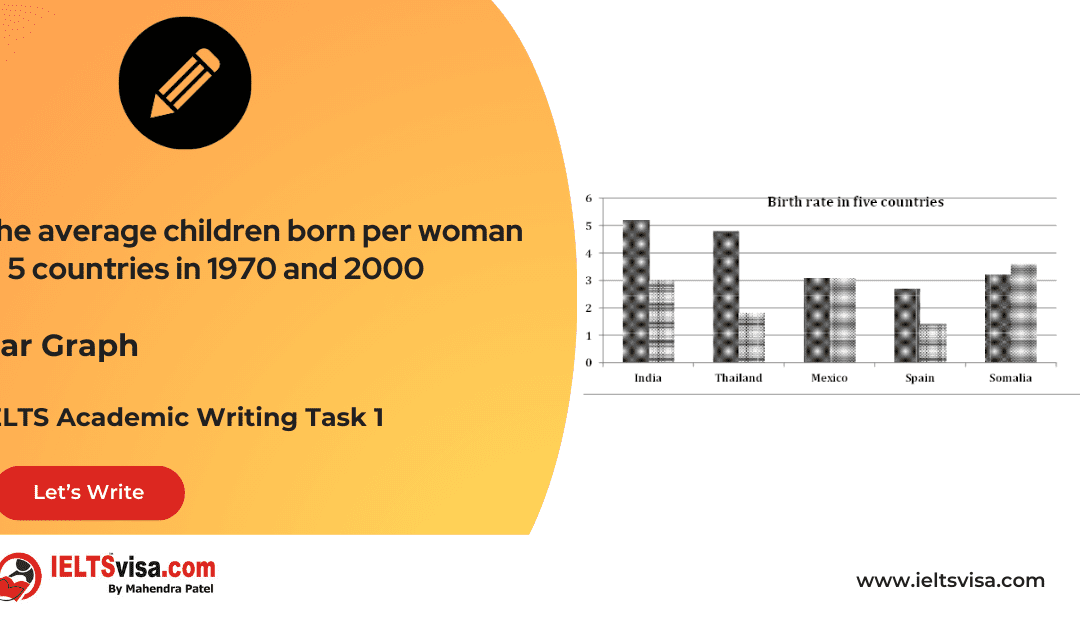
The average children born per woman in 5 countries in 1970 and 2000 IELTS Academic Writing Task 1 - Bar Graph 20:00 Start Pause Stop IELTS Writing Task 1 Question The bar chart below shows about the average children born per woman in 5 countries in 1970...