TV Viewing Habits of Canadians from 1990-2000.
IELTS Academic Writing Task 1 - Bar Charts
IELTS Writing Task 1 Question
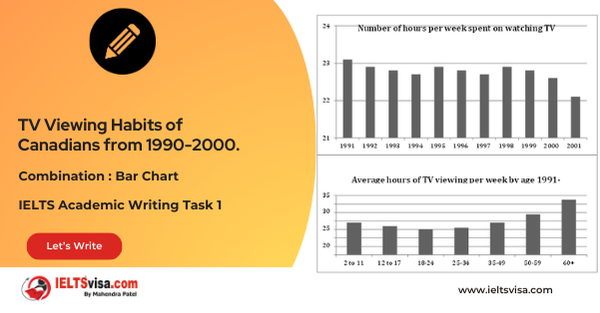
The graphs below show the number of hours Canadians spend on watching TV from 1990 -2000. Summarise the information by selecting and reporting the main features and make comparisons where relevant.

Common Questions for Data Summary
1. Diagram Type: Two graphs showing TV viewing habits of Canadians.
2. Title: TV Viewing Habits of Canadians from 1990-2000.
3. What is being described?: The average number of hours Canadians spent watching TV between 1990 and 2000, and the number of hours watched by different age groups in 2000.
4. Where is this process happening?: The graphs represent TV viewing patterns in Canada.
5. What is the data about?: The changes in TV viewing habits among Canadians over the decade and the differences in viewing time across various age groups.
6. Topic: Changes in TV viewing behavior in Canada and differences between age groups.
Comparison Showing and Trends
1. TV Viewing from 1990-2000: The first graph shows a decline in TV viewing from 1991 to 1994, with a brief recovery in 1995, followed by a steady decrease until 2000, when it reached its lowest point at 22.1 hours per week.
2. Age Group Preferences in 2000: The second graph shows that older age groups watched more TV. People over 60 watched 32.5 hours per week, while 18-24-year-olds watched the least (just under 15 hours per week). Most other age groups watched between 16 and 24 hours per week.
3. Trends: TV viewing decreased overall in Canada between 1990 and 2000. Adults tended to watch more TV with age, while children and teenagers watched less.
Sample Answer
The two graphs provide insights into the TV viewing habits of Canadians between 1990 and 2000 and show a distinct decline in TV viewing over this period.
Overall, it can be concluded that while Canadians reduced their TV watching over the decade, TV viewing habits were more common among older adults, with younger Canadians watching less TV.
In 1991, the average Canadian watched slightly over 29 hours of TV each week. This number steadily declined to about 22.7 hours in 1994. While there was a slight recovery in 1995, from that point onwards, TV viewing continued to decrease, reaching its lowest point in 2000 with just 22.1 hours per week.
The second graph highlights the differences in viewing habits among various age groups in 2000. Older Canadians, particularly those aged over 60, watched the most TV, averaging 32.5 hours per week. In contrast, the youngest age group (18-24 years old) watched the least, with just under 15 hours per week. Other age groups, including children, teenagers, and adults, watched between 16 and 24 hours per week.
Top 27 Vocabularies
| Vocabulary | Meaning | Synonyms | Examples | Type |
|
Fluctuated |
To change frequently in amount or level |
Vary, swing, oscillate |
“The number of hours spent watching TV fluctuated over the years.” |
Verb |
|
Recovery |
The process of returning to a normal state after a decline |
Comeback, rebound |
“TV viewing saw a recovery in 1995.” |
Noun |
|
Decline |
A decrease in number or quality |
Drop, reduction, decrease |
“TV viewing declined steadily from 1991 to 1994.” |
Verb |
|
Preferences |
A greater liking for one alternative over others |
Liking, inclination, choice |
“Older age groups had a stronger preference for watching TV.” |
Noun |
|
Overall |
Taking everything into account |
Generally, in total |
“Overall, TV viewing decreased among the Canadian population over the decade.” |
Adjective |
|
Insights |
A deep understanding of a subject |
Understanding, awareness |
“The graphs provide insights into TV viewing habits in Canada.” |
Noun |
|
Habit |
A regular practice or tendency |
Routine, custom |
“TV viewing habits changed significantly over the years.” |
Noun |
|
Trend |
A general direction of change |
Pattern, movement |
“A downward trend in TV watching was observed between 1990 and 2000.” |
Noun |
|
Average |
A number representing a typical value |
Mean, median |
“The average TV watching hours dropped from 29 to 22.1 per week.” |
Noun |
|
Steadily |
In a continuous and consistent manner |
Gradually, progressively |
“TV watching steadily declined over the decade.” |
Adverb |
|
Decrease |
To become smaller in number or amount |
Reduce, drop |
“TV viewing hours continued to decrease over time.” |
Verb |
|
Lowest |
The smallest or least in value |
Minimum, least |
“TV viewing reached its lowest point in 2000.” |
Adjective |
|
Peak |
The highest point of something |
Maximum, summit |
“TV watching peaked in the early 1990s before declining.” |
Noun |
|
Recovery |
A return to a previous state |
Improvement, resurgence |
“A slight recovery in TV viewing was seen in 1995.” |
Noun |
|
Viewing |
The act of watching something |
Watching, observing |
“Older Canadians had higher TV viewing hours than younger ones.” |
Noun |
|
Declining |
Becoming lower or fewer in amount |
Dropping, reducing |
“TV consumption has been declining over the years.” |
Verb |
|
Common |
Frequently occurring or widespread |
Widespread, usual |
“TV viewing was more common among older adults.” |
Adjective |
|
Generation |
A group of people born in the same time period |
Age group, cohort |
“Different generations displayed varying TV viewing habits.” |
Noun |
|
Age group |
A classification of people by age |
Demographic, category |
“TV viewing hours differed across various age groups.” |
Noun |
|
Contrast |
A noticeable difference between two things |
Difference, distinction |
“There was a contrast between young and old in TV watching habits.” |
Noun |
|
Moderate |
Neither too high nor too low in amount |
Average, medium |
“Teenagers had a moderate amount of TV viewing.” |
Adjective |
|
Consistently |
In a stable and regular way |
Regularly, steadily |
“Older adults consistently watched more TV than younger viewers.” |
Adverb |
|
Significantly |
In a way that is large or important |
Considerably, notably |
“TV viewing significantly decreased over the decade.” |
Adverb |
|
Viewership |
The audience or number of people watching |
Audience, spectators |
“TV viewership saw a steady decline from 1990 to 2000.” |
Noun |
|
Proportion |
A part or percentage of a whole |
Ratio, share |
“A large proportion of older adults watched TV for longer hours.” |
Noun |
|
Drastic |
Severe and sudden in effect |
Extreme, sharp |
“There was a drastic fall in TV viewing after 1995.” |
Adjective |
|
Demographic |
A particular sector of the population |
Population segment |
“TV habits varied depending on the demographic group.” |
Noun |


Our Books

Master IELTS Speaking Part 1
IELTS Writing Task 1 Book
IELTS Writing Task 2 Book
Writing Task 1 Question Types
Practice IELTS Other Modules
IELTS Listening
The IELTS Listening test assesses how well you can understand spoken English in various contexts. It lasts about 30 minutes and is divided into four sections with a total of 40 questions. The listening tasks become increasingly difficult as the test progresses.
IELTS Academic Reading
The IELTS Academic Reading section assesses your ability to understand and interpret a variety of texts in academic settings. It is designed to evaluate a range of reading skills, including skimming for gist, reading for main ideas, reading for detail, understanding inferences, and recognizing a writer's opinions and arguments.
IELTS Speaking
The IELTS Speaking test assesses your ability to communicate in English on everyday topics. It lasts 11-14 minutes and consists of three parts: introduction, cue card, and a discussion based on the cue card topic.
IELTS General Reading
IELTS General Reading tests your ability to understand and interpret various types of texts. Here are some key areas and types of content you can expect to encounter in the reading section, along with tips for effective preparation.
IELTS Academic Writing Task 1
In IELTS Academic Writing Task 1, you are presented with a visual representation of information, such as graphs, charts, tables, or diagrams, and you are required to summarize, compare, or explain the data in your own words.
IELTS General Writing Task 1
In IELTS General Writing Task 1, you are required to write a letter based on a given situation. The letter can be formal, semi-formal, or informal, depending on the prompt. Here’s a breakdown of the key components to include in your letter
IELTS Academic Writing Task 2
In IELTS Academic Writing Task 2, you are required to write an essay in response to a question or topic. Here’s a guide to help you understand the essential elements of this task
IELTS Exam Tips
To succeed in the IELTS exam, practice regularly, familiarize yourself with the test format, improve your vocabulary, develop time management skills, and take mock tests to build confidence.
Grammer for IELTS
Grammar is the foundation of effective communication in English. Understanding tense usage, subject-verb agreement, and sentence structure enhances clarity and coherence in writing and speaking.
Vocabulary for IELTS
Vocabulary plays a crucial role in the IELTS (International English Language Testing System) exam, especially in the Speaking and Writing sections. Here’s an overview of why vocabulary is important and how it impacts your performance
RECENT IELTS SAMPLES QUESTIONS AND ANSWERS
Task 1 – Diagram – A conference hall built in 1981 and planned for 2020
20:00 Start Pause Stop [df_adh_heading title_infix="IELTS Writing Task 1 Question" use_divider="on"...
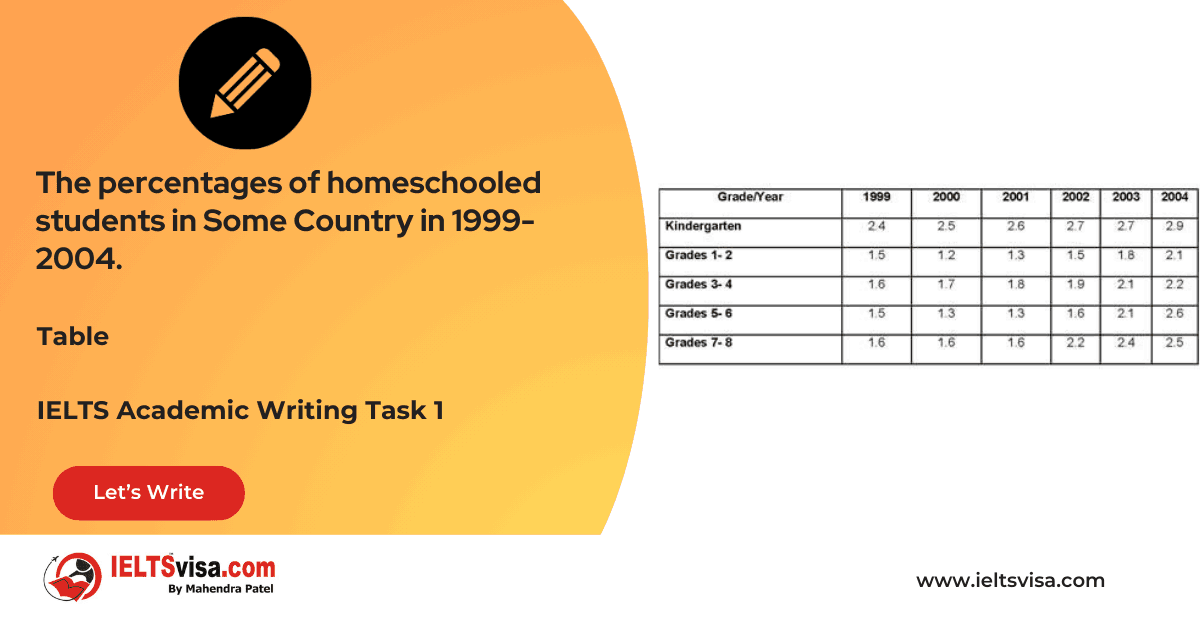
Task 1 – Table – The percentages of homeschooled students in Some Country in 1999-2004.
20:00 Start Pause Stop [df_adh_heading title_infix="IELTS Writing Task 1 Question" use_divider="on"...
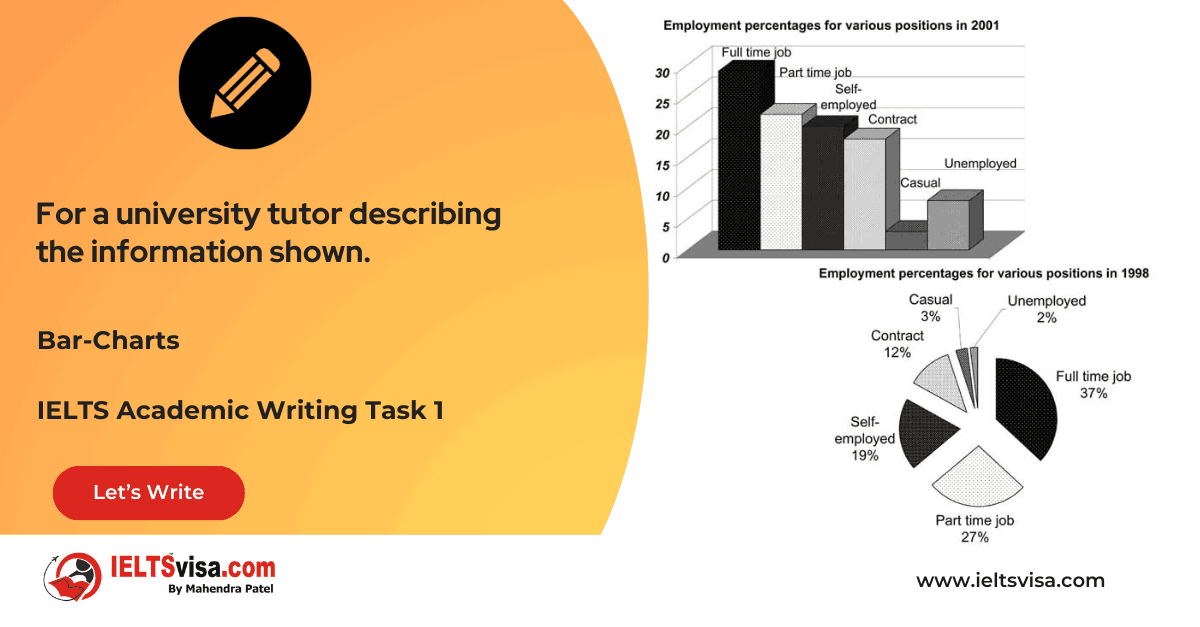
Task 1 – Table – For a university tutor describing the information shown.
20:00 Start Pause Stop [df_adh_heading title_infix="IELTS Writing Task 1 Question" use_divider="on"...
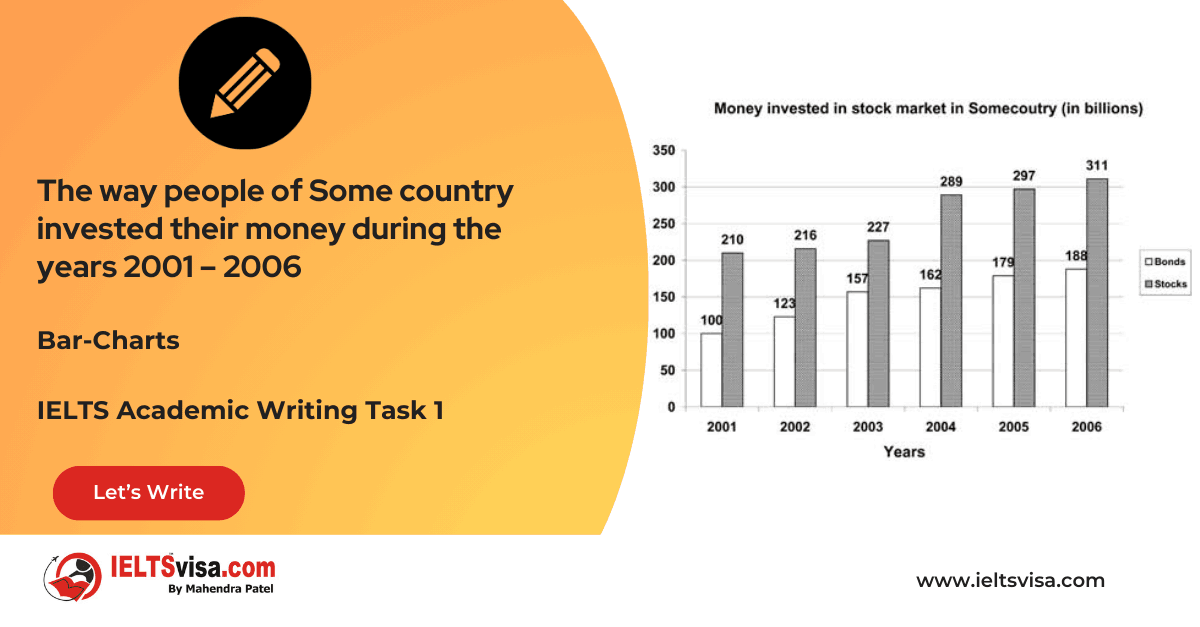
Task 1 – Bar-Charts – The way people of Some country invested their money during the years 2001 – 2006
20:00 Start Pause Stop [df_adh_heading title_infix="IELTS Writing Task 1 Question" use_divider="on"...

Task 1 – Diagram – Rainwater Harvesting and Conversion to Drinking Water in an Australian Town.
20:00 Start Pause Stop [df_adh_heading title_infix="IELTS Writing Task 1 Question" use_divider="on"...

Task 1 – Column graph – Percentage of Young People Enrolled in Universities in 2000 and 2007.
20:00 Start Pause Stop [df_adh_heading title_infix="IELTS Writing Task 1 Question" use_divider="on"...
Our IT Company Services


