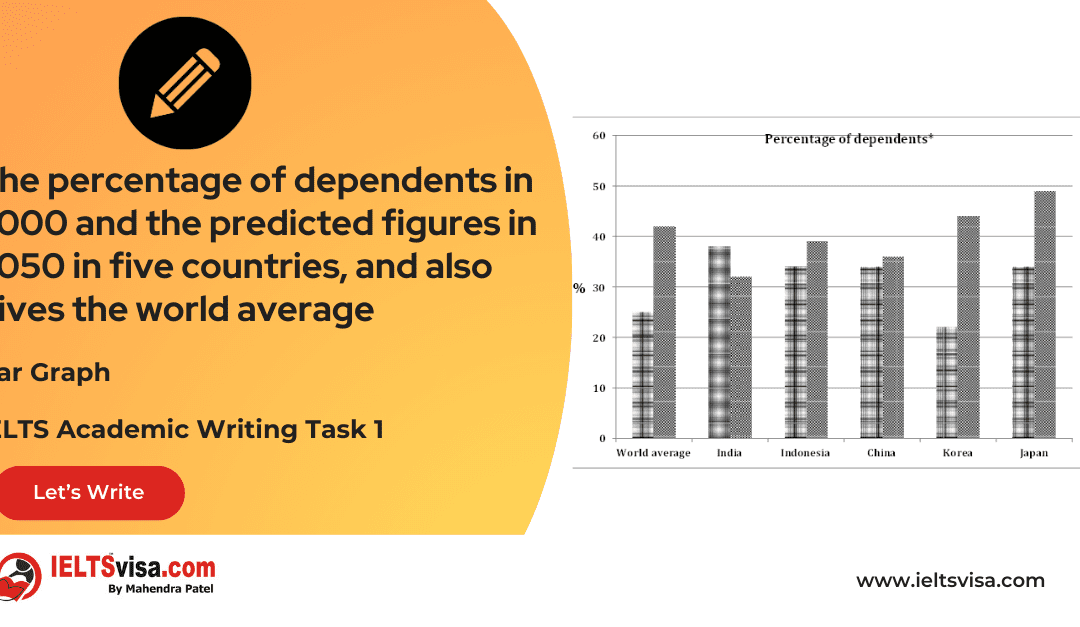
by Mahendra Patel | Jan 19, 2025 | Bar Charts, IELTS Academic Writing Task 1 Essay
The percentage of dependents in 2000 and the predicted figures in 2050 in five countries, and also gives the world average IELTS Academic Writing Task 1 - Bar Graph 20:00 Start Pause Stop IELTS Writing Task 1 Question The graph below shows the percentage...
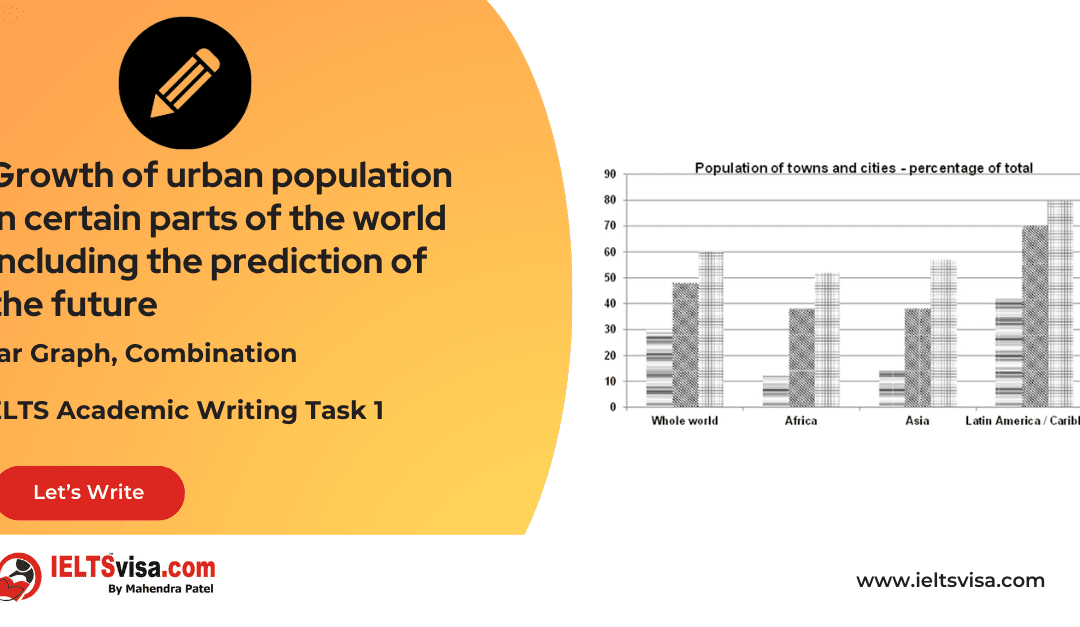
by Mahendra Patel | Jan 15, 2025 | Bar Charts, IELTS Academic Writing Task 1 Essay
Growth of urban population in certain parts of the world including the prediction of the future IELTS Academic Writing Task 1 - Bar Graph 20:00 Start Pause Stop IELTS Writing Task 1 Question The chart below gives information about the growth of urban population in...
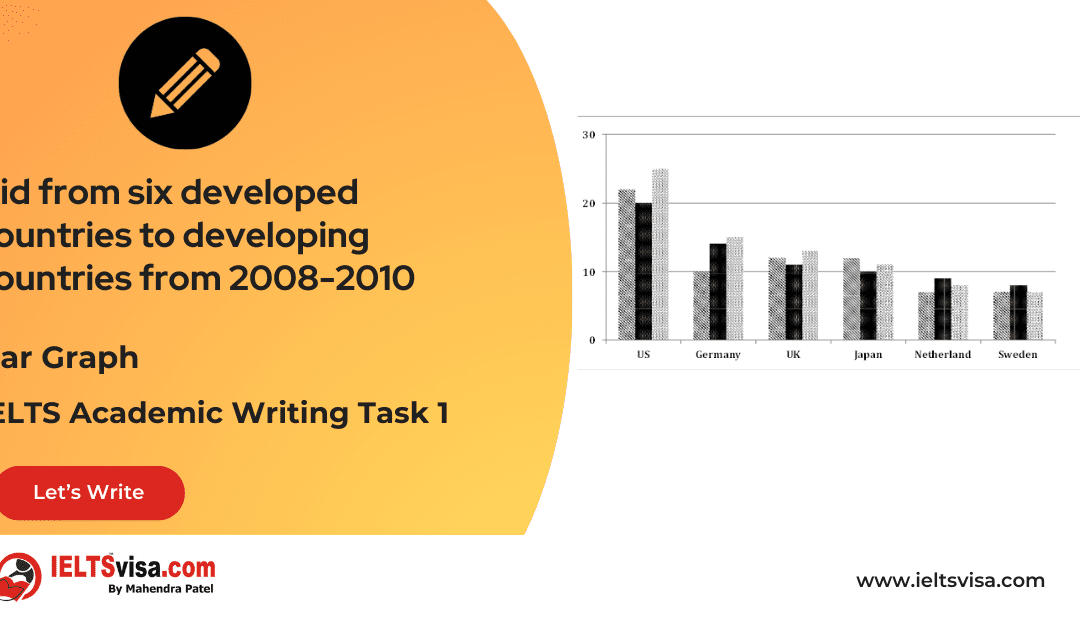
by Mahendra Patel | Jan 15, 2025 | Bar Charts, IELTS Academic Writing Task 1 Essay
The six developed countries to developing countries from 2008-2010 IELTS Academic Writing Task 1 - Bar Graph 20:00 Start Pause Stop IELTS Writing Task 1 Question The chart below shows the aid from six developed countries to developing countries from 2008-2010....
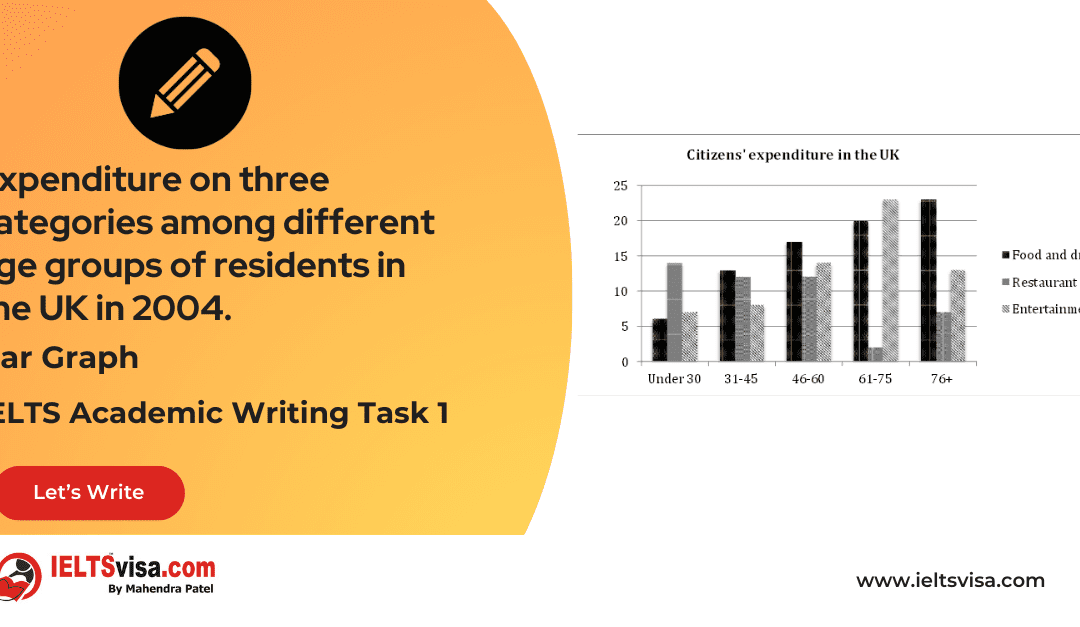
by Yash Patel | Jan 15, 2025 | Bar Charts, IELTS Academic Writing Task 1 Essay
The expenditure on three categories among different age groups of residents in the UK in 2004 IELTS Academic Writing Task 1 - Bar Graph 20:00 Start Pause Stop IELTS Writing Task 1 Question The chart below shows the expenditure on three categories among different age...