by Mahendra Patel | Feb 6, 2025 | IELTS Academic Writing Task 1 Essay, Line Graphs
The population size, birth rate and the death rate of England and Wales from 1700 to 2000 IELTS Academic Writing Task 1 - LineGraph 20:00 Start Pause Stop IELTS Writing Task 1 Question The line graph below shows the population size, birth rate and the...
by Mahendra Patel | Feb 6, 2025 | IELTS Academic Writing Task 1 Essay, Line Graphs
The sales of children's books, adult fiction and educational books between 2002 and 2006 in one country. IELTS Academic Writing Task 1 - Line Graph 20:00 Start Pause Stop IELTS Writing Task 1 Question The graph below shows the sales of children’s...
by iVenzu Technologies | Jan 24, 2025 | IELTS Academic Writing Task 1 Essay, Line Graphs
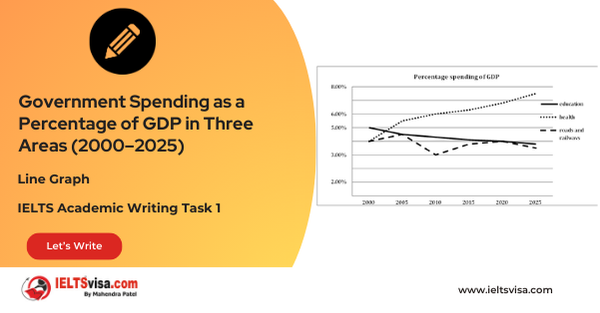
Government Spending as a Percentage of GDP in Three Areas (2000–2025) IELTS Academic Writing Task 1 - Line Graph 20:00 Start Pause Stop IELTS Writing Task 1 Question The given graph shows the past and projected figures of the government spending as a percentage of GDP...
by Mahendra Patel | Oct 22, 2023 | IELTS Academic Writing Task 1 Essay, Line Graphs
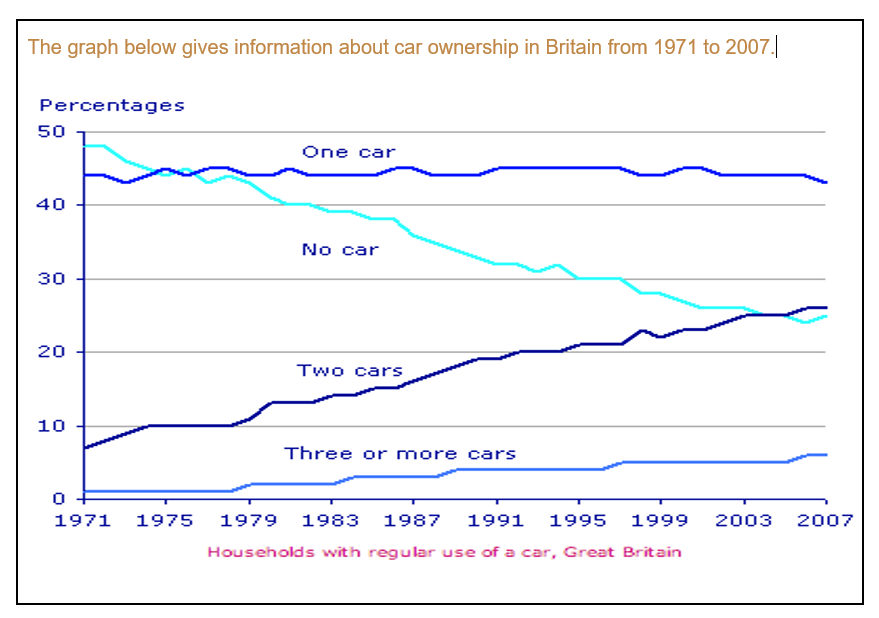
Common questions for the line graph, bar graph, pie chart, and table Graph Type: Line Graph Title: Car Ownership in Britain from 1971 to 2007 What are the units of measurement? (e.g., percentage, kilogrammes, the number of people or periods, amount, %, age, etc.) :...